Dashboards – wall screens with KPI widgets
Dashboards let you set up a screen in the warehouse – for example above the picking hall or in an office – and show key figures (KPIs) in real time via widgets that you assemble yourself in a grid.
How to find Dashboards
- Go to Settings.
- Select Dashboards.
Dashboards is a paid add-on module. You are billed DKK 49/month per dashboard.
Overview of dashboards
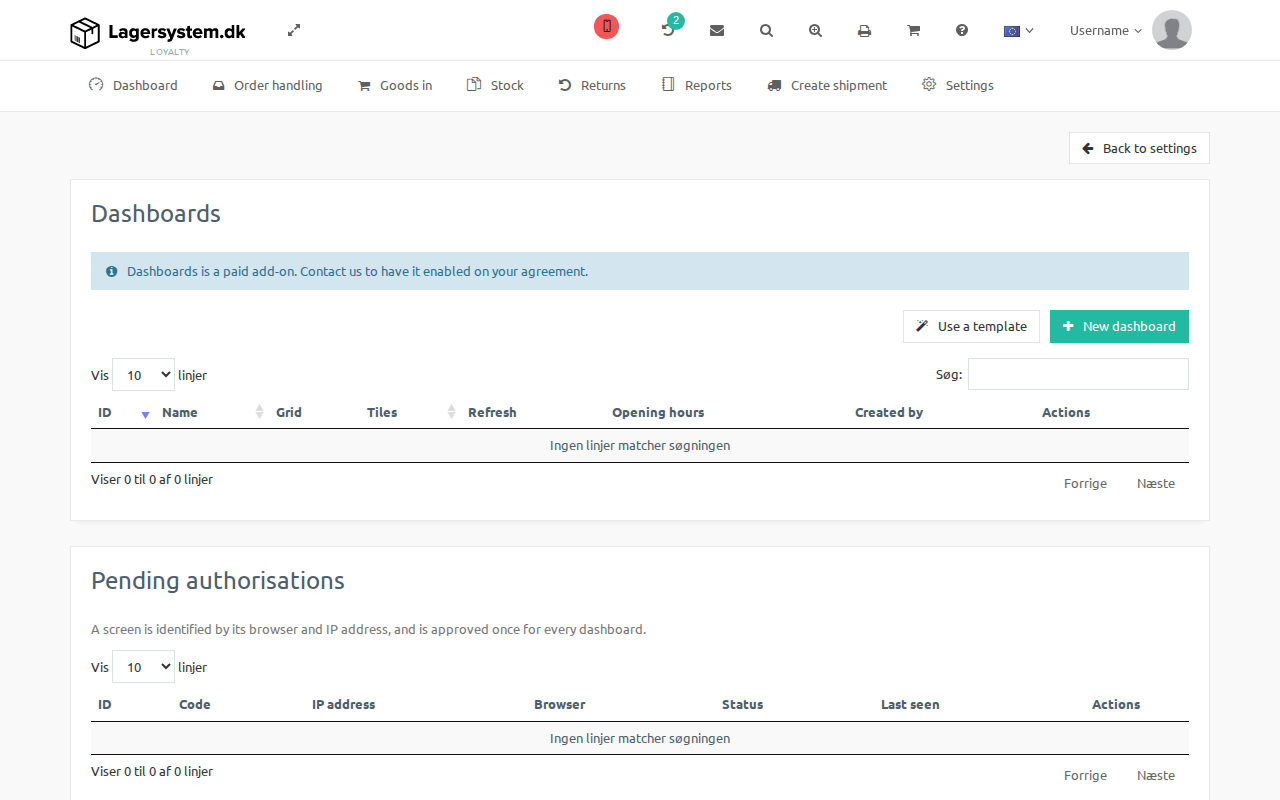
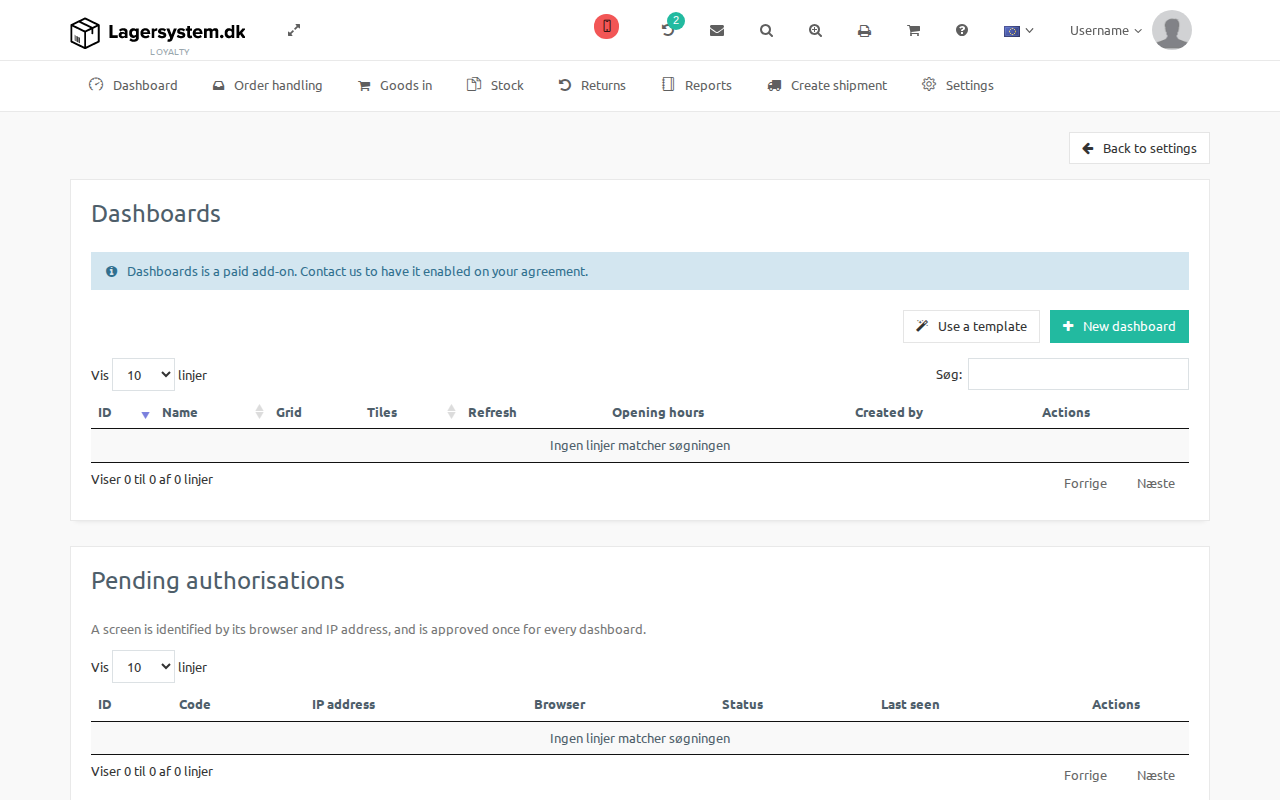
The page shows a list of your dashboards with the columns ID, Name, Grid, Tiles, Refresh, Opening hours, Created by and Actions.
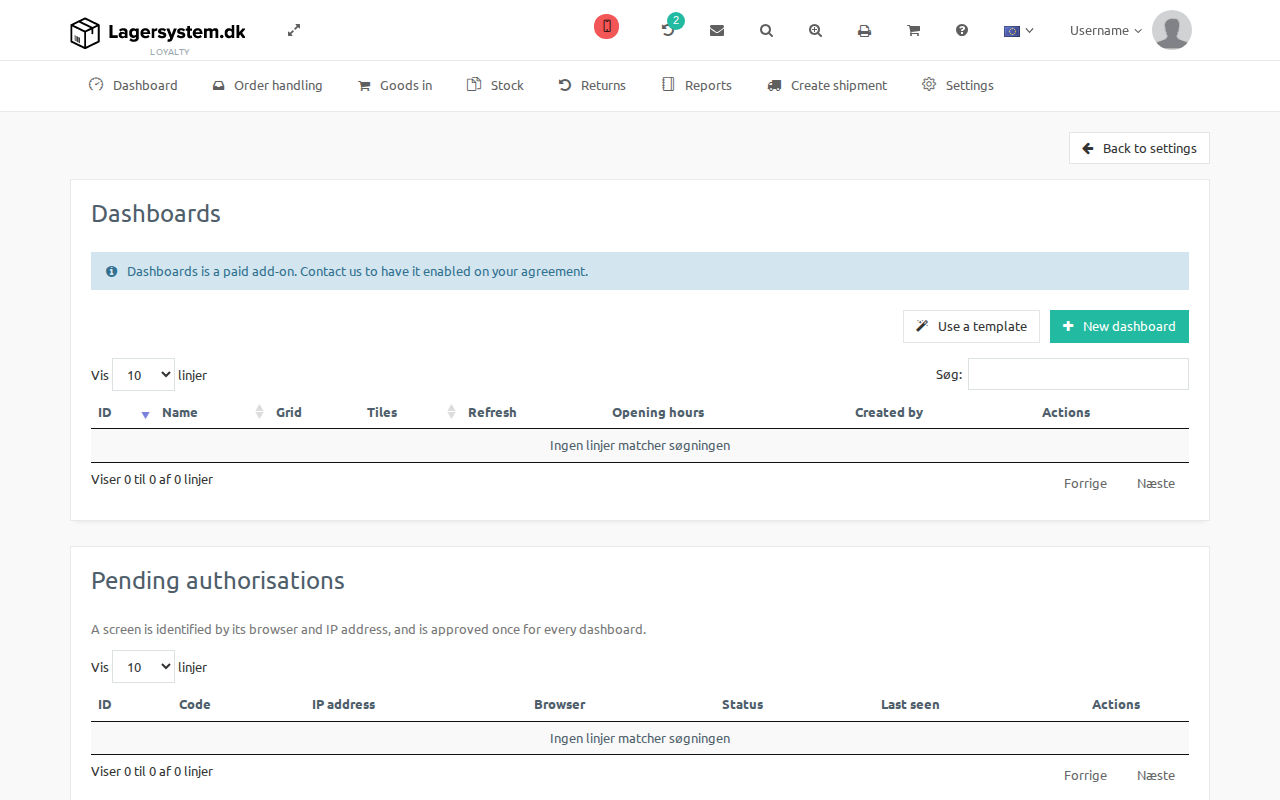
Below the list you'll find Pending authorisations: a screen is identified by its browser and IP address and is approved once for all dashboards. As soon as a new screen opens a dashboard link without being approved yet, it shows a pairing screen with a code instead of the figures – approve it from here, and it can then display any of your dashboards. The table shows ID, Code, IP address, Browser, Status, Last seen and Actions.
Create a new dashboard
Click New dashboard to start from scratch, or Use a template to choose a predefined setup from a list showing the template's name, grid size, number of tiles and a short description.
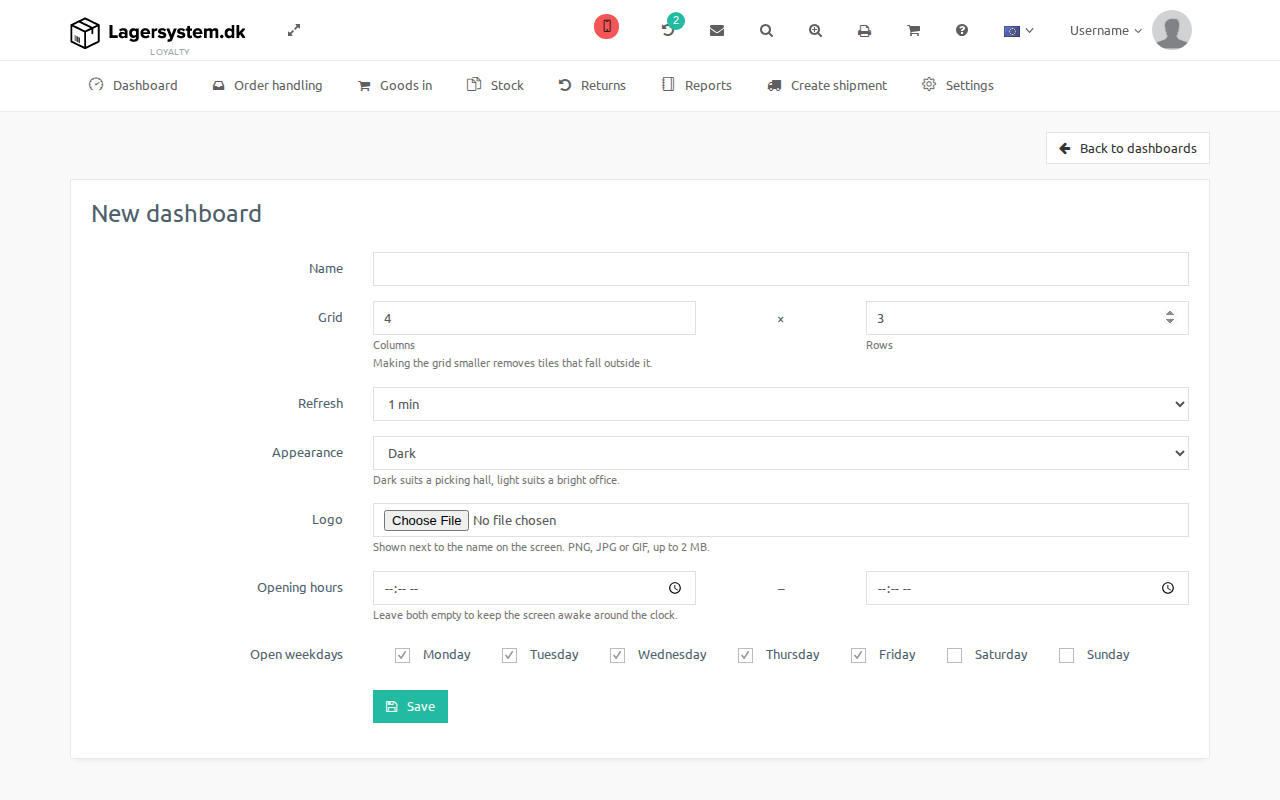
In the form, fill in:
- Name – the dashboard's name.
- Grid – the number of Columns and Rows. Making the grid smaller removes tiles that fall outside it.
- Refresh – how often the screen fetches new figures, e.g. "1 min".
- Appearance – Dark or Light. Dark suits a picking hall, light suits a bright office.
- Logo – shown next to the name on the screen. PNG, JPG or GIF, up to 2 MB.
- Opening hours – set the time period during which you need the dashboard to refresh. Outside the set time period, the dashboard will "sleep". Leave both fields empty to keep the screen awake around the clock.
- Open weekdays – which weekdays the dashboard should show data (Monday–Friday are checked by default).
Click Save to create the dashboard.
Edit a dashboard and add KPI tiles
Once a dashboard has been created, the edit page opens with the same settings as during creation, along with links to the screen that should display the dashboard (both a short link and the underlying link), buttons to generate a new link and to clone the entire dashboard.
The grid itself is where you build the screen's content: each cell can be filled with a KPI widget. Drag widgets into the grid from the list on the right (drag and drop). When a widget is dragged in, a window opens where the specific KPIs can be entered and where the individual widget can be configured. Among other things, you can filter by subsites, tags, shipping methods, status, etc.
Once a widget has been placed, you can move it and resize it in the grid, and some widgets also have their own settings you can adjust.