Location heatmap report
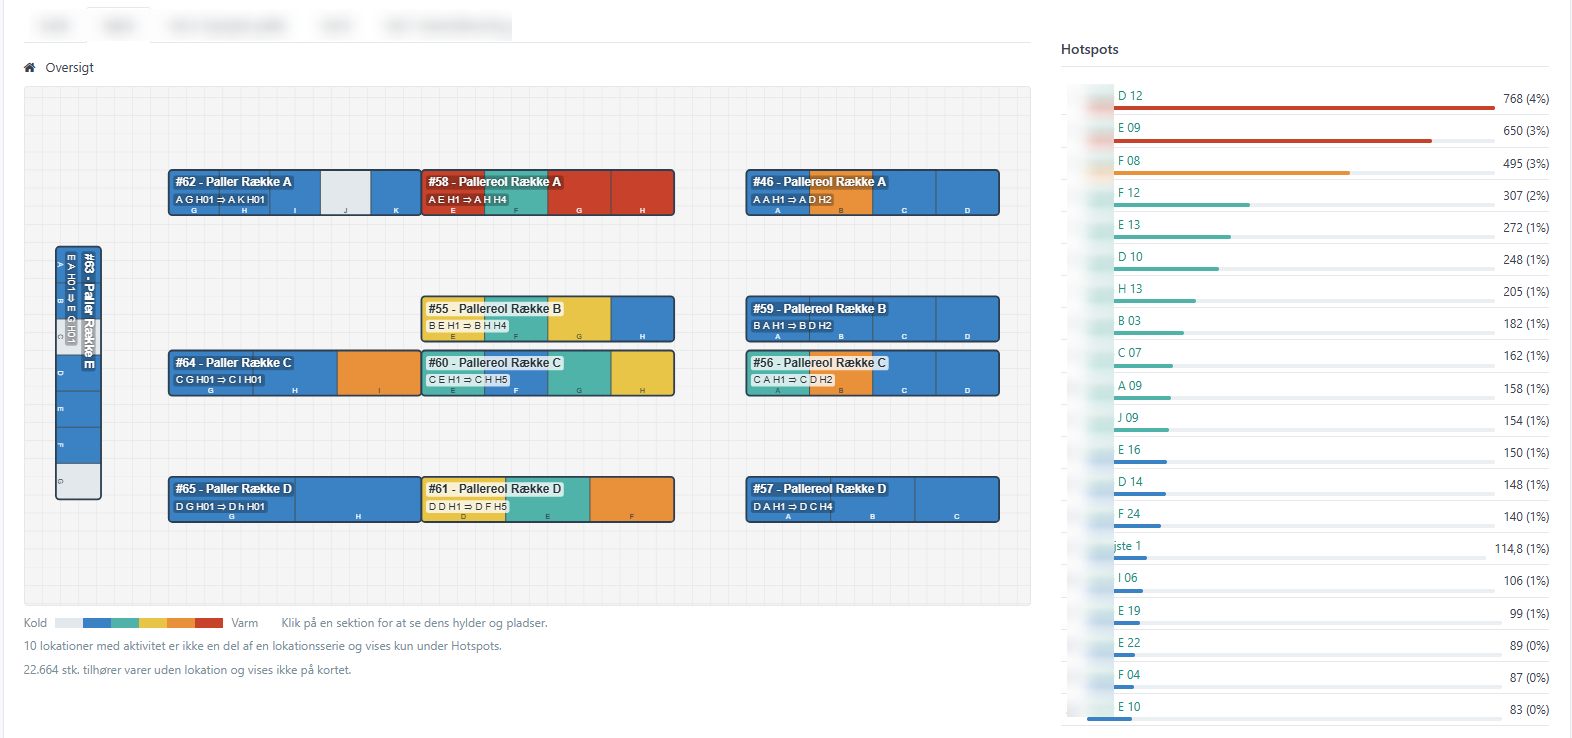
The location heatmap report shows how much pick activity happens at each location in the warehouse, visualised directly on the warehouse's layout plan. Locations with more picks or units are drawn warmer (closer to red), locations with little or no activity stay cold (blue/grey), so you can quickly spot overloaded or underused parts of the warehouse.
Opening the report
- Open Reports in the top menu.
- Select the Location heatmap report.
Filters
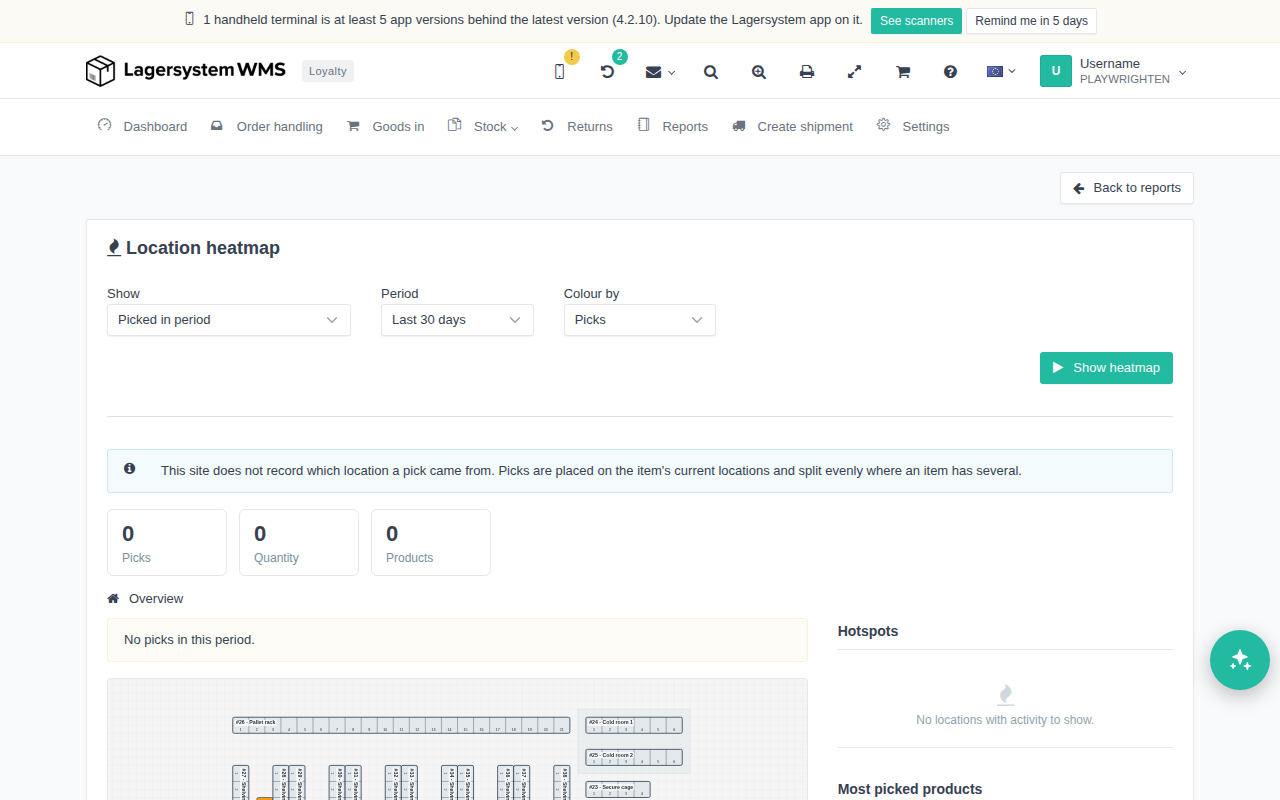
Before you run the report, you can set:
- Show — switches between activity picked within the selected period and the picks still missing on open orders that have not yet been shipped. When pending is selected, the period controls are hidden, since pending demand is not tied to a date period.
- Period — the reporting window for picked activity: a preset period such as Last 30 days, or a custom start/end date range.
- Colour by — what the heat colour represents: Picks (number of picks) or Quantity (quantity picked).
- When more than one warehouse layout plan is configured, a plan selector is also shown, so you can choose which plan the heatmap should be drawn on.
Click Show heatmap to display the report with the current filters.
Reading the results
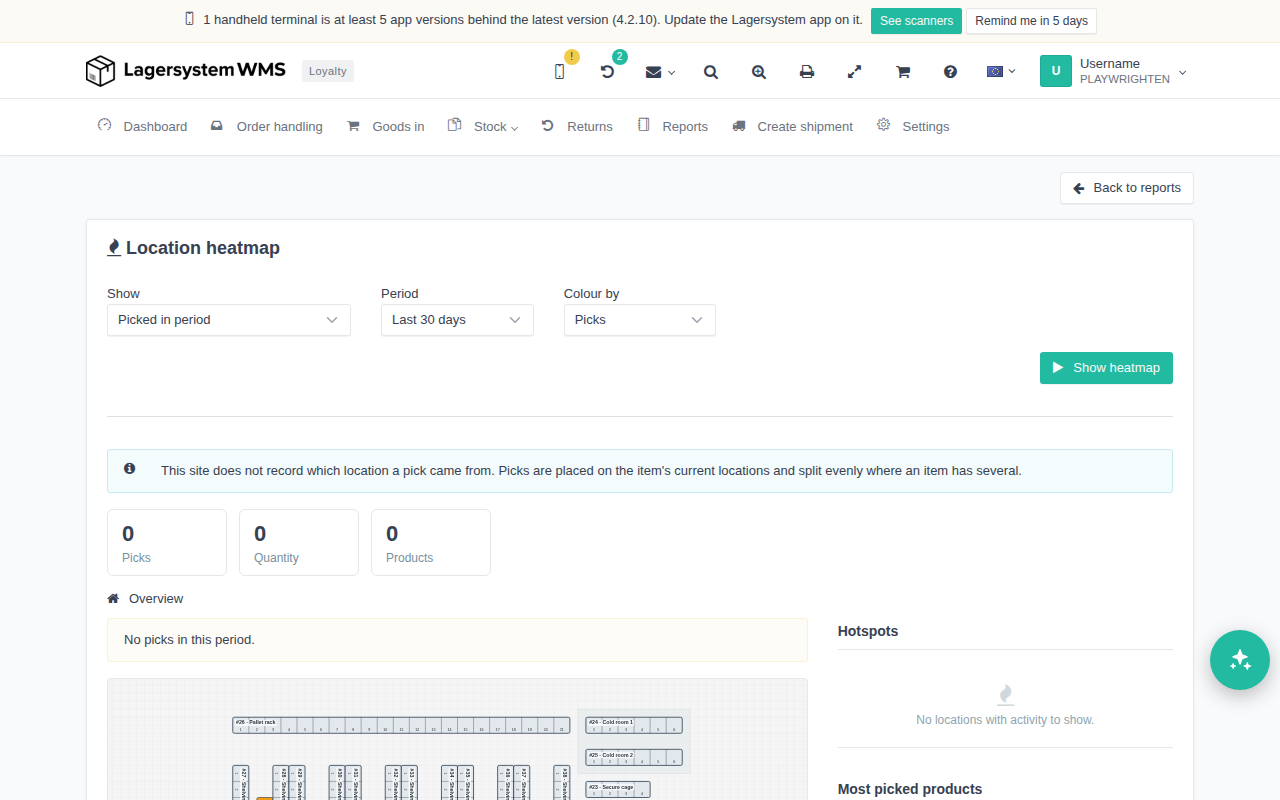
At the top, three cards summarise the period: Picks (number of picks), Quantity (amount) and Products (number of distinct products). If nothing has been picked in the period, the cards show 0, and a message like "No picks in this period." is shown instead of the heatmap.
On sites that do not record which exact location a pick came from, a message is shown stating that the activity is estimated: "This site does not record which location a pick came from. Picks are placed on the item's current locations and split evenly where an item has several." — meaning that picks are placed on the item's current location(s) and split evenly when an item exists on more than one location.
The overview shows your existing active warehouse visualisation, if you have one. If not, you will be shown your location series instead. The main panel then shows:
- The warehouse's layout plan, drawn to correct scale exactly as in the layout editor, where each shelf section is coloured by its heat, with a cold-to-hot legend underneath. If no layout plan has locations placed on it, the overview instead shows one row per location series, with its sections as standalone coloured cells.
- Click on a coloured section to drill down and see its shelf-by-shelf grid with each individual location and its heat value. Use the link back to the overview to leave the section view.
On the right, Hotspots shows the locations with the most activity, and Most picked products shows the products picked the most, both ranked by the measure selected under Colour by. When there is no activity to show, these lists show placeholder text such as "No locations with activity to show."